ETF Prime Archive

Check out our archive of podcasts

Asset Allocation Using ETFs

Asset allocation is a fancy name to describe how a portfolio is divided among asset classes; i.e., what percentage of an overall portfolio is in bonds, stocks, real estate, etc. Contrary to what the financial services industry would have you believe, asset allocation is not filling in your Morningstar style boxes like some game of bingo. Another overly simplistic rule of thumb is you should take 100 minus your age and that is the percentage that should be in stocks and the rest in bonds. Anyone following these “methods” over the last decade is probably not real happy with the results.

There is a different way. A way that manages risk, is tax efficient and finds those areas with solid returns. That way is applying a trend following or relative strength philosophy to asset allocation. Trend following has been around for hundreds of years and has been analyzed, pushed, prodded and poked by a multitude of academics, analysts and researchers. They have uniformly found that trend following beats the market over time. Shhhh – don’t tell the efficient market believers.

In fact, popular indices like the S&P 500 index are extremely difficult for amateur and professional investors to beat. The popular wisdom is that this is because the market is efficient. The dirty little secret is that these indices, because of how they are constructed, actually follow a trend following or relative strength strategy.

The S&P 500 index is generally comprised of the 500 largest capitalization stocks headquartered in the US. Stocks in the S&P 500 that outperform the index become a bigger portion of that index since the index is market cap weighted. Stocks in the S&P 500 that underperform the index become a smaller portion. This is a relative strength strategy – let the winners run and cut the losers. The S&P 500 index periodically adds new firms that grow and qualify for inclusion – i.e., buys winners; and periodically kicks out companies that no longer qualify – i.e., sells losers. This strategy is a relative strength or momentum strategy – buy or add to positions that are outperforming and sell or subtract from positions that are underperforming. This relative strength strategy actually is a very big reason this index is so hard to beat.

Relative strength investing can be applied to your entire portfolio. This is commonly called tactical asset allocation but to me it is just common sense. A simple way to apply relative strength to your portfolio is to first decide which asset classes to which you want exposure. In the past, unless you had several million dollars to give to a hedge fund or specialized investment manager, this meant stocks and bonds. One of the huge advantages that ETFs bring to the table is exposure to many more asset classes: gold, commodities, emerging market stocks, different types of bonds, interest rates and currencies. This advantage allows individuals to employ strategies that a decade ago were extremely costly to implement. The second step is to rank those asset classes by recent performance. You would then buy or add to those asset classes that ranked high – i.e., have performed well; and sell or subtract from those asset classes that ranked poorly.

An simple example may help explain this strategy: my friend “Bob” chooses the following asset classes to consider: large cap US stocks, small cap US stocks, international stocks, emerging market stocks, US treasuries, corporate bonds, international bonds, China, gold and commodities. There are liquid, inexpensive ETFs for each of these 10 categories. Every three months, he ranks these 10 ETFs by their past 12 month total returns. He then rebalances his overall portfolio so that 75% of his portfolio is in the top five ETFs and 25% is in the bottom five ETFs.

Relative strength investing will not get you out at the tops or in at the bottoms in the financial markets. There are no strategies, processes, gurus, tools or tea leaves that will consistently call tops or bottoms in markets. As asset classes or financial markets start to deteriorate, a relative strength strategy will rotate your portfolio away from those areas and into those showing strength or improvement. Bear markets in all asset classes are not sudden affairs – they take time to play out. The most recent bear market in global equities took 18 months to play out. Even the crash of 1987 was not a sudden affair – the US stock market started showing signs of deterioration well before that October. This rotation away from deteriorating asset classes is a key risk management tool as the bulk of declines tend to come in the later stages of bear markets.

Another way to think of relative strength investing is with the old adage that there is always a bull market somewhere. A relative strength strategy seeks to find those bull markets. Simply shifting some assets into areas of strength and away from areas of weakness can make a huge difference in returns.

Popular wisdom holds that buy and hold is the way to go – or at least it was until 2000. Popular wisdom also holds that you should hold both stocks and bonds. The press is breathless with stories about which professional investor has the “hot hand.” Interestingly, the vast majority of variability in an investor’s portfolio returns is not due to which stock or mutual fund or ETF was chosen for each asset class. The vast majority of variability of returns comes from how much is invested in each asset class. Whether investors considered 2008 a good or bad year for their portfolios depended on how much they had in stocks versus how much they had in bonds. Investors who owned what was strong in 2008 – bonds – and avoided what was weak – stocks and commodities – likely were much happier than those buy and holders who stuck with stocks.

3 ETFs Impacted By Financial Legislation

After weeks of deliberation, the U.S. Congress passed the final version of legislation for the first major overhaul of the nation’s financial system since the Great Depression, imposing more restrictions on Wall Street and banks and impacting several stocks and exchange traded funds (ETFs) which track the sector.

This final version will give the government new powers to break up companies that threaten the economy, create a new agency to protect consumers in their financial transactions and shine a light into shadow financial markets that escaped the oversight of regulators.  More specifically, the law will restrict banks from prop trading by limiting the amount an institution can invest in a hedge fund or private-equity fund to a maximum 3% of the bank’s capital. Companies most likely to be influenced by this regulation include big players like JP Morgan Chase (JPM), Goldman Sachs (GS), Bank of America (BAC), Wells Fargo (WFC) and Morgan Stanley (MS).

Another facet of a tighter leash on large financial companies comes from the comprehensive regulation in the over-the-counter (OTC) markets.  With the new law, routine derivatives will have to be traded on exchanges or other electronic systems and routed through clearinghouses, which increases transaction costs.  Additionally, banks who participate in derivatives trading are going to be required to turn their derivatives trading operations into affiliates.

A third artery of the new law includes an increase in the deposit-insurance fee paid by banks to the Federal Deposit Insurance Corporation (FDIC), eating away at cash that can be used to generate revenue.  In addition to this increase, the new law requires banks that package loans to keep 5% of the credit risk on their balance sheet and allow regulators to exempt certain “low-risk” mortgages from this requirement.

Lastly, the new law revamps the credit-rating industry which allows investors to sue credit-rating firms for “knowing or reckless” failure and gives the Securities and Exchange Commission (SEC) the power to deregister a firm that gives too many bad ratings over time.

In a nutshell, the new law is expected to expand consumer protection and clamp down on lending practices and may be beneficial to the average consumer, however, it is likely to have a negative impact on revenue generation and the overall bottom line of the large financial institutions.

Some ETFs that are likely to be influenced by the new law include:
• Financial Select Sector SPDR (XLF), which boasts JP Morgan Chase , Bank of America and Wells Fargo as its top holdings.
• iShares Dow Jones US Financial Services (IYG), which includes Goldman Sachs and Citigroup in its top holdings.
• Vanguard Financials ETF (VFH), which gives ample exposure to the aforementioned firms as well as includes The Travelers Companies (TRV) and Aflac (AFL), which are expected to be impacted by the newly constructed Federal Insurance Office to monitor the insurance industry and give it two cents on ways to modernize insurance regulation.

The Benefits of ETFs

With the plethora of investment tools at one’s hands and the concept of indexing flooding newswires, exchange traded funds (ETFs) and their counterparts are extremely attractive and for good reason.

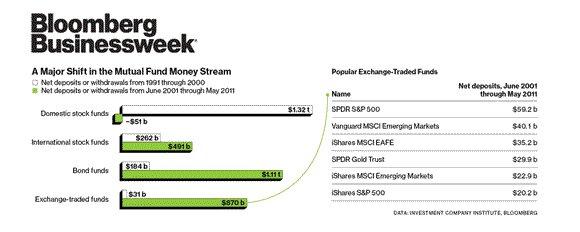
An alert investment advisor has probably heard of ETFs, but may not really know what they offer. In a nutshell, ETFs offer the ability to be traded intraday on an exchange, unlike traditional mutual funds which can only be bought and sold at the end of a trading day. ETFs give investors the ability to access hard to reach markets, like commodities, currencies and emerging markets, while being able to be sold short or utilized as a hedging tool. They are open-ended structures, which provides liquidity.

Additionally, the vast majority of ETFs are passively managed and track an index as opposed to being actively managed, which generally drives up costs. When it comes to taxes, ETFs are typically much friendlier than mutual funds due to their in-kind redemption and creation process, which prevents the triggering of capital gains.  They also rarely change their holdings, meaning they rarely have distributions.

Lastly, ETFs offer a characteristic that should be of utmost importance, transparency. One knows exactly what and how many shares of stocks, bonds, futures contracts or swaps an ETF holds on a daily basis. As for mutual funds, they are only required to disclose holdings on a quarterly basis.

Granted, ETFs carry expense ratios, but they still tend to be lower than the front-end or back-end loads, 12b-1 fees, management fees and other expenses associated with mutual funds. An investor knows exactly how much an ETF will cost without any hidden fees. To add icing to the cake, most ETFs actually move in tandem with their indexes, whereas the majority of actively managed mutual funds fail to match the performance of their respective benchmarks.

ETFs are a growing market and are here to stay. At the end of the May 2010, ETFs and ETNs (exchange traded notes) boasted nearly $798 billion in assets with 995 different listed products.

Claymore Brings Back Shipping ETF

As global economies start to show signs of life and growth, ETF provider, Claymore Securities recently announced the re-launch of the Claymore Shipping ETF (SEA), giving investors an opportunity to play a potential increase in global trade and a growing maritime shipping industry. If you have a shipping company, check out https://www.conexwest.com/.

SEA seeks to replicate the performance of the Delta Global Shipping Index which includes companies that derive at least 80% of their revenues from operating or leasing ships or from the transportation of goods. Another prerequisite of the companies that are included in the Delta Global Shipping Index is that they have at least $250 million in market capitalization and a 30-day average daily trading volume of at least $2 million.

As for SEA, the ETF will carry an expense ratio of 0.65% and allocates nearly 68.9% of its sector weightings to industrials and the remaining 31.1% to energy.

Additionally, it boasts Seaspan Corp (SSW), Teekay Shipping Corp (TK), General Maritime Corp (GMR) and Teekay Tankers (TNK) as its top holdings. Lastly, SEA allocates its assets with the following geographical weightings: Greece (18.55%), United States (12.31%), Bermuda (10.29%), Japan (10.24%), Hong Kong (10.01%) and China (8.43%).

During the global recession, many ships were sidelined in an effort to reduce idle capacity, however, things are slowly starting to change. This change can be illustrated by the recent performance of the Baltic Dry Shipping Index, which measures shipping costs for commodities, and generally increases as the number of shipments increases. The Index is up nearly 28% over the past four months.

In a nutshell, as long as economies around the world continue to grow and the demand for transporting goods increases, the global maritime shipping industry will likely reap the benefits.

Skip to content