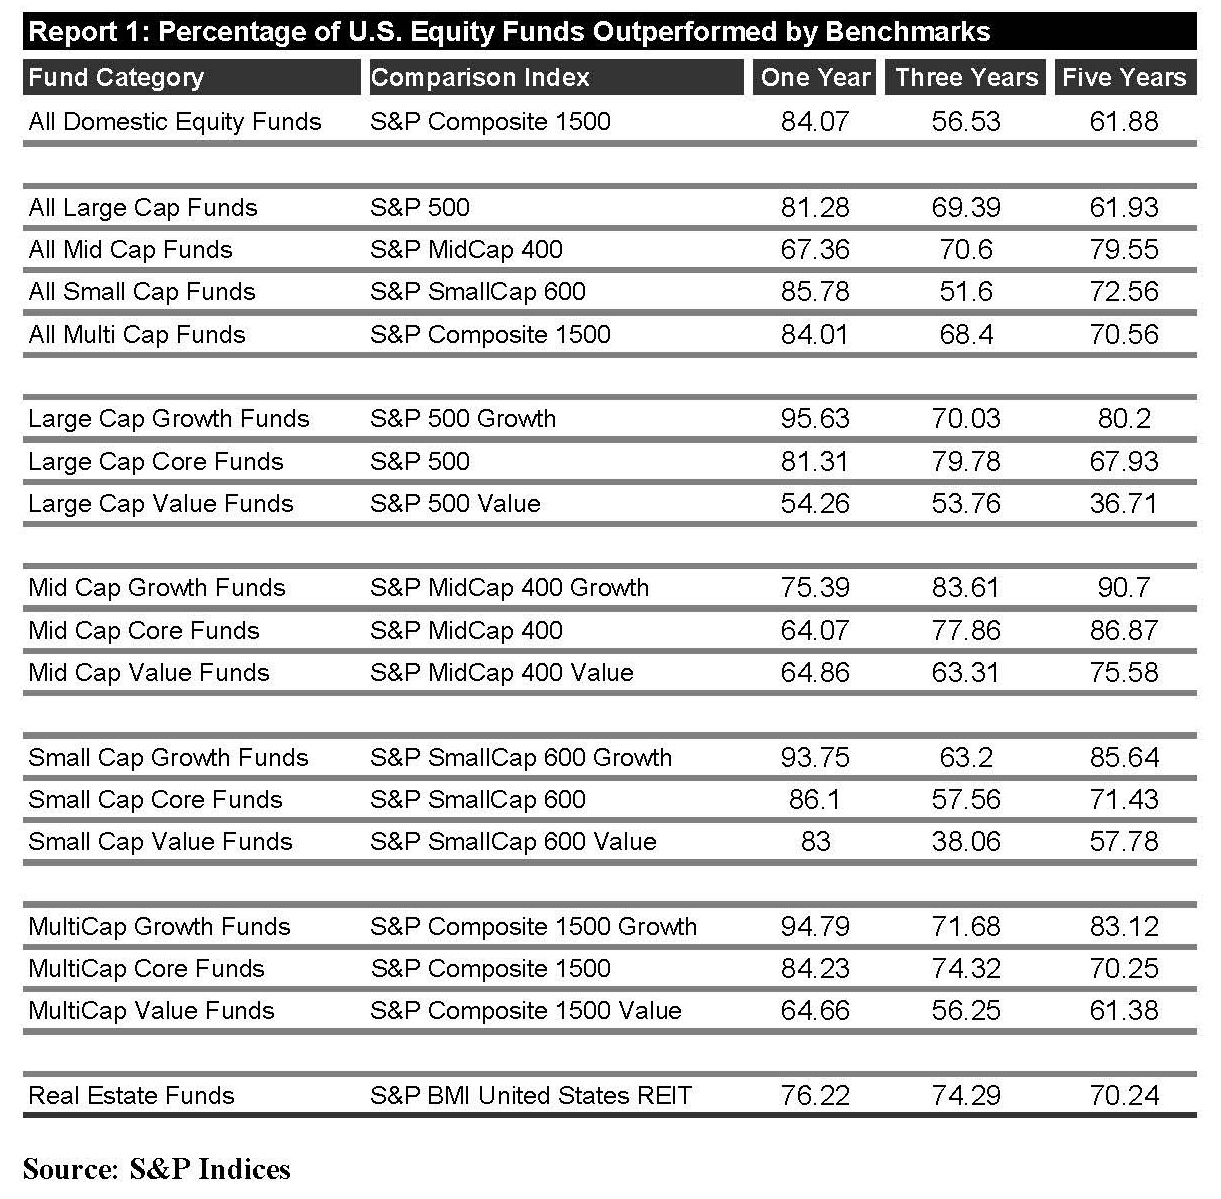
If you’ve been following our commentary, whether through our blog or on our radio show, you know that a favorite subject of ours is the underperformance of actively managed mutual funds. In case you missed it, approximately 84% of actively managed US equity mutual funds underperformed their relative S&P benchmark in 2011. That’s right – 84%! Over the past three and five years, 56% and 61%, respectively, of actively managed US equity mutual funds have underperformed their benchmark. Here’s a full chart of the carnage from SPIVA:
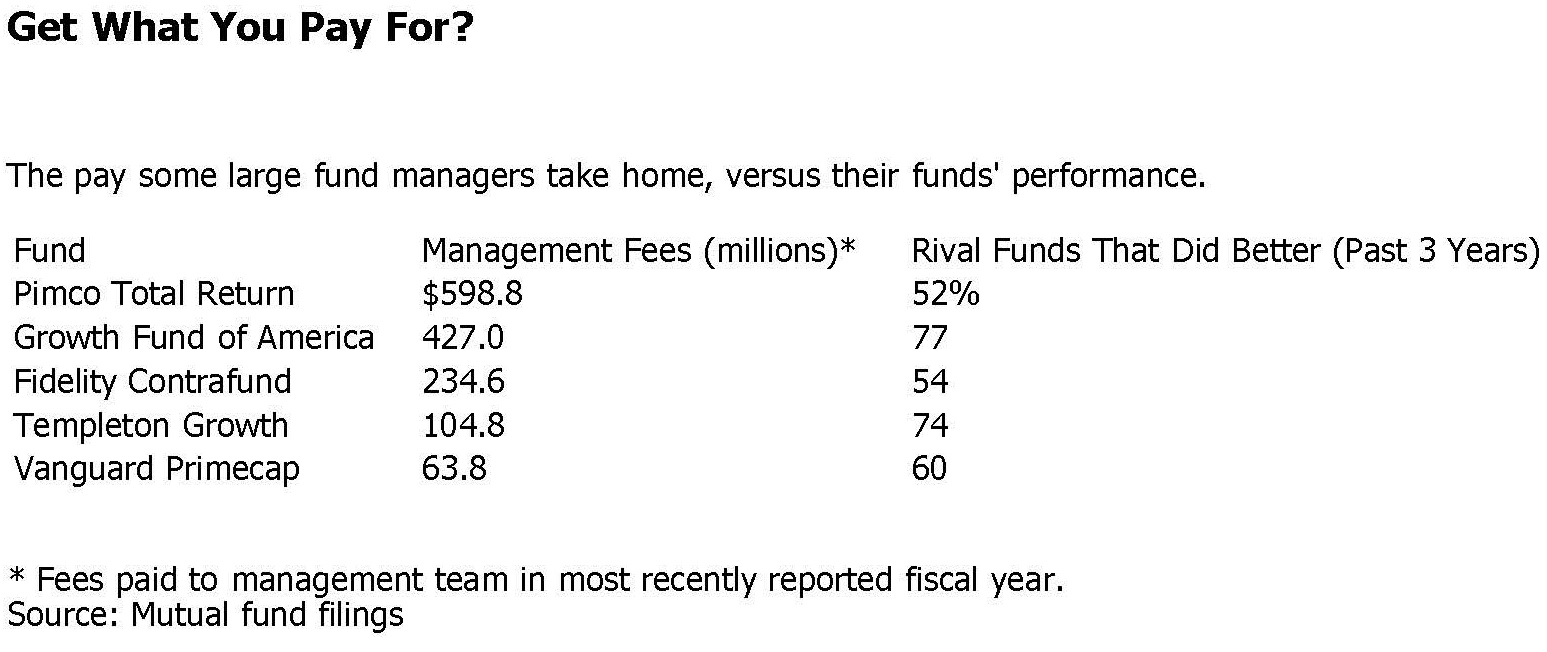
But wait, it gets worse. Not only do investors get this severe underperformance with actively managed mutual funds, but they also get to overpay for this gross underperformance. A recent article from smartmoney.com provided an excellent graphic depicting this. The below chart from the article shows the money that five of the largest mutual funds out there is raking in from investors and more importantly, how these funds are performing (or not) relative to their competition:


