Most investors recall the pain they suffered during the most recent market meltdown as a pelting by multiple, highly correlated collapses in asset values packed into the fall of 2008.
The reality, however, is that performance breakdowns got underway back in May of 2007 and cascaded over the next sixteen months across all non-treasury, non-agency asset classes. There was smoke, and lots of it, well before October 2008.
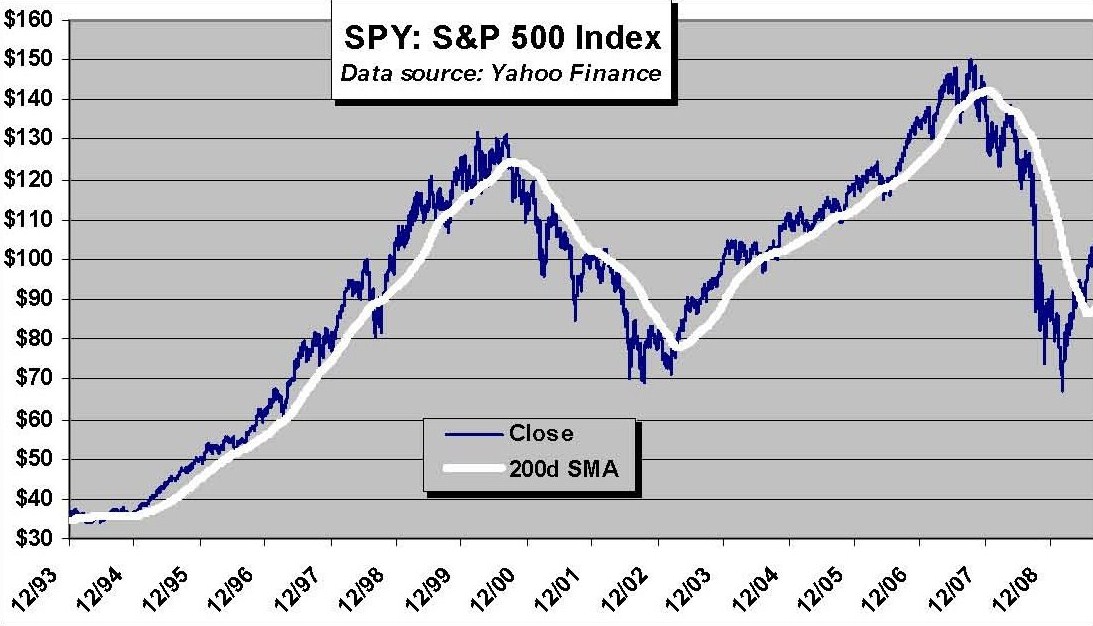
So where was smoke to be found? In the breakdown of long-term price trends. Price crossovers relative to the long-term 200-day moving average can provide important insights regarding a changing risk environment. People often say that a picture is worth a thousand words.
Here’s just such a picture, illustrating how clearly trend-oriented performance can be for a major asset class. Note the price crossover relative to the 200-day moving average in late 2007.
So,what’s the lesson to be learned? Know where you are relative to long-term price trends. Whatever analysis and investment strategy one might employ, all investors ought to regularly cast an eye on long-term price trends for signs of smoke, as such warnings nearly always precede the appearance of fire.


